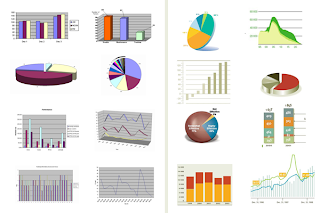
We can use excel to create graphs based on
data collected. We can then use these graphs to interpret the data. By doing
this our graphs will serve a purpose instead of just being a picture. Click on
the link to view an example of interpreting a graph.

No comments:
Post a Comment