Monday, 25 June 2012
Survey Questions
In our Tuesday evening sessions we have been
spending lots of time on Microsoft Access. I have designed a survey to try and
gauge how much people have learnt about Microsoft Access. Click on the link to
view the survey.
Wednesday, 13 June 2012
Communication Modes
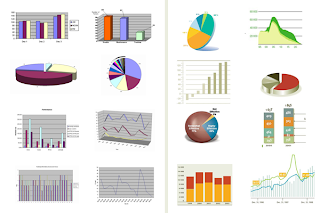
We can use excel to create graphs based on
data collected. We can then use these graphs to interpret the data. By doing
this our graphs will serve a purpose instead of just being a picture. Click on
the link to view an example of interpreting a graph.
Creating a interface in Access
I was required to create a database. When this
database is opened it should open with a interface based on the autoexec macro.
This activity was fun and sometimes even challenging, but really interesting.
Click on this link to view my database.
Subscribe to:
Posts (Atom)


